

Cart is empty
ReadinGraphics distills top nonfiction books into summaries you can actually use, whether you’re preparing for a coaching session, pulling a framework into a presentation, leading a team discussion, or deepening your own learning practice. Every title comes in three formats: a structural infographic that maps how the book’s ideas connect, a detailed text summary, and a narrated audio walkthrough. Built by a dedicated, fully remote team headquartered in Singapore.
Why we build every summary by hand
If you’re the kind of person who reads nonfiction to actually learn and use it, you’ll know the challenges: unsure which books to read, not enough time to read them all, hard to digest the dense information, and even harder to adapt them for your situation or recall what you need when the time comes.
You can’t trust most book summary services or AI tools because they don’t capture the details that matter, or miss the point completely. And it’s tough to create or organize your own book notes.
That’s why ReadinGraphics exists. It’s also why we still build every summary by hand.
Because that’s the only way to extract what truly matters, in a way you can find and use it later: by having qualified people who use book insights do the work. Not machines. Not commercial writers.
What goes on behind the scenes
-
Read the whole book
We read every book cover to cover. Not just the chapters that seem important, but the whole thing. Because you can't map how ideas connect if you haven't seen all of them.
-
Build the visual architecture
Then we build the book's complete structure into a single visual map. When a book doesn't come with its own diagram (and most don't), we design one from scratch. When ideas are abstract, we make them concrete and visible.
The hardest part isn’t the reading. It’s the visual thinking: figuring out how a framework connects to the book’s other ideas, and making 300 pages of argument clear enough that you can see it all at once.
60+
professional hours per book — because getting the structure
and nuances right, so you can actually use it, takes real care.
and nuances right, so you can actually use it, takes real care.
We pioneered the infographic book summary over a decade ago. We’re still the only book summary service that maps how a book’s ideas connect, because it requires building each one by hand.
When you can see the whole structure of a book, you understand it faster and remember more of it. That’s what a structural infographic gives you.
More than visual
Sometimes you need to see the whole book's argument at a glance, and find or share a framework in seconds. Other times you need to dive into details or reinforce learning.
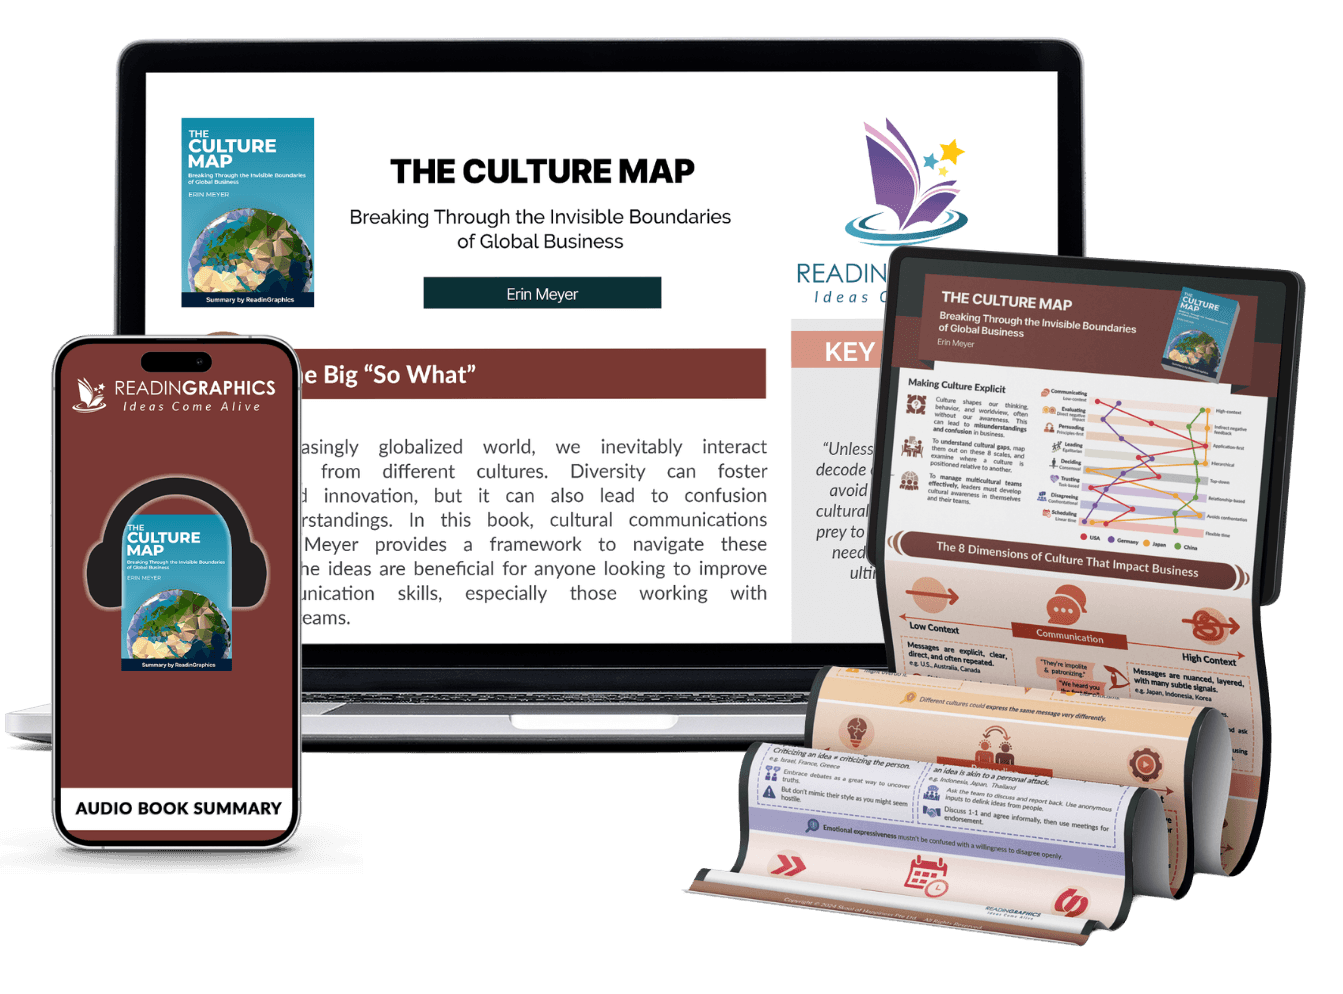
Structural infographic
The whole book's argument at a glance. Find or share a framework in seconds. Print it, pin it, pull it into a presentation.
Detailed text summary
Steps, examples, context. Enough to apply the ideas, cite them, or feed into AI tools for personalized output.
Narrated audio
Professionally narrated. Listen on the go, between meetings, or while reviewing the infographic.
Each format does a different job: the infographic shows the big picture, the text gives you the detail to apply it, and the audio lets you absorb the thinking on the go.
And not every book makes the cut. We filter to 3 new titles per month — books with real frameworks you can apply at work. Every one of the close to 400 titles in the library earned its place.
Why we exist
I started ReadinGraphics because I had a problem with no solution available. I’d read a great book, take away 2-3 ideas, and forget the rest within a month. I couldn’t keep track of which concepts came from which books, couldn’t find my book notes, and never had enough time to read everything I wanted to.
I tried other book summaries. Some gave me lists of key points, some were long study guides, and others simply got the book wrong. None worked as a reference I could trust and return to, or helped me see how the ideas fit together.
Nobody was making that. So I started building visual maps of books myself, working with experts in learning design, information architecture, and visual communication, and eventually arrived at our first infographics that lay out the whole book on one page, showing how all the ideas connect.
That was over a decade and close to 400 books ago. Today, our team brings decades of combined experience across learning design, information architecture, visual communication, editorial craft, and business strategy, working from 8 countries. Every summary reflects that range, because getting a book right means understanding how people learn, how to structure information visually, and how to make complex ideas clear.
We still read every book cover to cover and build every summary by hand. It takes longer than you’d think. But every time someone tells us the infographic helped them see a book differently, it reminds us why we do it this way.

Angela Lam
Founder & CEO
Where to next?
See how it works
Open a sample summary and explore the infographic, text, and audio for yourself.
View sample →Browse the library
Close to 400 titles across leadership, strategy, productivity, psychology, and more.
Explore →Plans & pricing
Flexible options from single purchases to unlimited access. Find what fits.
See plans →Common questions
Formats, downloads, sharing with teams, switching plans, and more.
Read FAQ →